> For the complete documentation index, see [llms.txt](https://docs.apryse.com/llms.txt). Markdown versions of documentation pages are available by appending `.md` to page URLs; this page is available as [Markdown](https://docs.apryse.com/core/create/document-creation-api/charts.md).
# Charts
Use the documentation creation API to add charts programmatically to a doc.
A `Chart` renders a data visualization from a JSON definition. The definition describes what to plot, type, title, theme, categories and series, while the API controls only the size.
See [chart definition JSON](/core/create/document-creation-api/chart-definition-json.md) for the full definition specification.
## The definition
The definition is a JSON string. Rather than hand-escaping JSON in string literals, we recommend building it with your JSON library of choice and passing the serialized result.
```json
{
"chartType": "bar",
"title": "Revenue by region (thousands CAD)",
"theme": "nature",
"data": {
"categories": { "data": ["Q1", "Q2", "Q3", "Q4"] },
"series": [
{ "name": { "data": ["North America"] }, "data": { "data": [1250, 1410, 1580, 1720] } },
{ "name": { "data": ["Europe"] }, "data": { "data": [910, 980, 1120, 1180] } },
{ "name": { "data": ["Asia Pacific"] }, "data": { "data": [640, 720, 905, 1010] } }
]
}
}
```
## Add a chart
`AddChart` takes the size in points and the definition string.
{% tabs %}
{% tab title="C#" %}
{% code lineNumbers="true" %}
```csharp
Paragraph para = doc.AddParagraph();
para.SetJustificationMode(Paragraph.TextJustification.e_center);
Chart chart = para.AddChart(400, 260, definition);
```
{% endcode %}
{% endtab %}
{% tab title="C++" %}
{% code lineNumbers="true" %}
```cpp
Paragraph para = doc.AddParagraph();
para.SetJustificationMode(Paragraph::e_text_justify_center);
Chart chart = para.AddChart(400, 260, definition);
```
{% endcode %}
{% endtab %}
{% tab title="Go" %}
{% code lineNumbers="true" %}
```go
para := doc.AddParagraph()
para.SetJustificationMode(ParagraphE_text_justify_center)
chart := para.AddChart(400, 260, definition)
```
{% endcode %}
{% endtab %}
{% tab title="Java" %}
{% code lineNumbers="true" %}
```java
Paragraph para = doc.addParagraph();
para.setJustificationMode(Paragraph.TextJustification.e_text_justify_center);
Chart chart = para.addChart(400, 260, definition);
```
{% endcode %}
{% endtab %}
{% tab title="JavaScript" %}
{% code lineNumbers="true" %}
```javascript
const para = await doc.addParagraph();
para.setJustificationMode(PDFNet.Paragraph.TextJustification.e_text_justify_center);
const chart = await para.addChart(400, 260, definition);
```
{% endcode %}
{% endtab %}
{% tab title="Obj-C" %}
{% code lineNumbers="true" %}
```objectivec
PTParagraph* para = [doc AddParagraph];
[para SetJustificationMode:e_ptpara_text_justify_center];
PTChart* chart = [para AddChart:400 height:260 definition:definition];
```
{% endcode %}
{% endtab %}
{% tab title="PHP" %}
{% code lineNumbers="true" %}
```php
$para = $doc->AddParagraph();
$para->SetJustificationMode(Paragraph::e_text_justify_center);
$chart = $para->AddChart(400, 260, $definition);
```
{% endcode %}
{% endtab %}
{% tab title="Python" %}
{% code lineNumbers="true" %}
```python
para = doc.AddParagraph()
para.SetJustificationMode(Paragraph.e_text_justify_center)
chart = para.AddChart(400, 260, definition)
```
{% endcode %}
{% endtab %}
{% tab title="Ruby" %}
{% code lineNumbers="true" %}
```ruby
para = doc.AddParagraph()
para.SetJustificationMode(Paragraph::E_text_justify_center)
chart = para.AddChart(400, 260, definition)
```
{% endcode %}
{% endtab %}
{% endtabs %}
Since the chart lives in a paragraph, it is positioned like any other inline content. Paragraph justification centers it, and a caption is simply the next paragraph.
## Chart types
Three chart families are available: Bar, pie, and radar. The full option set for each is documented in Chart Definition JSON.
### Bar
A bar chart is a clustered column chart with a category axis, a value axis, gridlines and a legend. Individual series can be switched to lines with `"line": true`, so columns and lines can be mixed in one chart.
### Pie
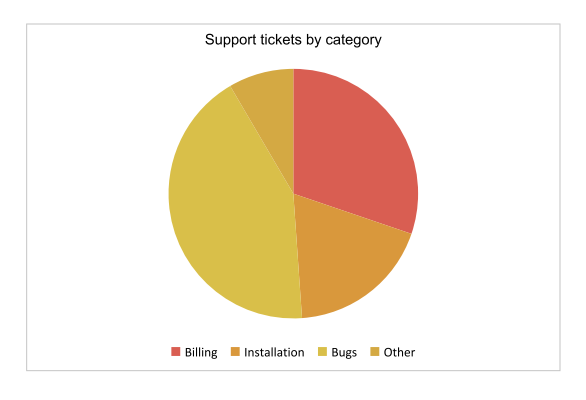
A pie chart is a single-series proportional chart. When the definition creates more than one series, a doughnut hole is applied automatically.
### Radar
A radar chart is a polar chart where every category is an axis radiating from the center. Radar series are always rendered as lines, which suits scorecards and multi-dimensional comparisons.
## Themes
The `theme` member applies a named palette to the series. Omit the theme to use the default palette. Options include:
* `pastel`
* `grayscale`
* `vivid`
* `nature`
* `sunset`
## Sizing
Chart size is **not** part of the definition. Pass it to `AddChart`, or change it later with `SetWidth` and `SetHeight`; the definition is unaffected.
{% tabs %}
{% tab title="C#" %}
{% code lineNumbers="true" %}
```csharp
Chart chart = para.AddChart(400, 260, definition);
chart.SetWidth(480);
chart.SetHeight(320);
```
{% endcode %}
{% endtab %}
{% tab title="C++" %}
{% code lineNumbers="true" %}
```cpp
Chart chart = para.AddChart(400, 260, definition);
chart.SetWidth(480);
chart.SetHeight(320);
```
{% endcode %}
{% endtab %}
{% tab title="Go" %}
{% code lineNumbers="true" %}
```go
chart := para.AddChart(400, 260, definition)
chart.SetWidth(480)
chart.SetHeight(320)
```
{% endcode %}
{% endtab %}
{% tab title="Java" %}
{% code lineNumbers="true" %}
```java
Chart chart = para.addChart(400, 260, definition);
chart.setWidth(480);
chart.setHeight(320);
```
{% endcode %}
{% endtab %}
{% tab title="JavaScript" %}
{% code lineNumbers="true" %}
```javascript
const chart = await para.addChart(400, 260, definition);
chart.setWidth(480);
chart.setHeight(320);
```
{% endcode %}
{% endtab %}
{% tab title="Obj-C" %}
{% code lineNumbers="true" %}
```objectivec
PTChart* chart = [para AddChart:400 height:260 definition:definition];
[chart SetWidth:480];
[chart SetHeight:320];
```
{% endcode %}
{% endtab %}
{% tab title="PHP" %}
{% code lineNumbers="true" %}
```php
$chart = $para->AddChart(400, 260, $definition);
$chart->SetWidth(480);
$chart->SetHeight(320);
```
{% endcode %}
{% endtab %}
{% tab title="Python" %}
{% code lineNumbers="true" %}
```python
chart = para.AddChart(400, 260, definition)
chart.SetWidth(480)
chart.SetHeight(320)
```
{% endcode %}
{% endtab %}
{% tab title="Ruby" %}
{% code lineNumbers="true" %}
```ruby
chart = para.AddChart(400, 260, definition)
chart.SetWidth(480)
chart.SetHeight(320)
```
{% endcode %}
{% endtab %}
{% endtabs %}
Give charts enough room: titles, axis labels and legends are laid out inside the requested box, so a chart that is too small will crowd them.
## Replace the definition
`SetDefinition` replaces the chart entirely. Any previously applied definition and styling derived from it is discarded, but the width and height are preserved.
{% tabs %}
{% tab title="C#" %}
{% code lineNumbers="true" %}
```csharp
chart.SetDefinition(updatedDefinition);
```
{% endcode %}
{% endtab %}
{% tab title="C++" %}
{% code lineNumbers="true" %}
```cpp
chart.SetDefinition(updated_definition);
```
{% endcode %}
{% endtab %}
{% tab title="Go" %}
{% code lineNumbers="true" %}
```go
chart.SetDefinition(updatedDefinition)
```
{% endcode %}
{% endtab %}
{% tab title="Java" %}
{% code lineNumbers="true" %}
```java
chart.setDefinition(updatedDefinition);
```
{% endcode %}
{% endtab %}
{% tab title="JavaScript" %}
{% code lineNumbers="true" %}
```javascript
chart.setDefinition(updatedDefinition);
```
{% endcode %}
{% endtab %}
{% tab title="Obj-C" %}
{% code lineNumbers="true" %}
```objectivec
[chart SetDefinition:updated_definition];
```
{% endcode %}
{% endtab %}
{% tab title="PHP" %}
{% code lineNumbers="true" %}
```php
$chart->SetDefinition($updated_definition);
```
{% endcode %}
{% endtab %}
{% tab title="Python" %}
{% code lineNumbers="true" %}
```python
chart.SetDefinition(updated_definition)
```
{% endcode %}
{% endtab %}
{% tab title="Ruby" %}
{% code lineNumbers="true" %}
```ruby
chart.SetDefinition(updated_definition)
```
{% endcode %}
{% endtab %}
{% endtabs %}
## Further Reading
* [Chart definition JSON](/core/create/document-creation-api/chart-definition-json.md) for the complete definition specification, including series options and trendlines.
* [Tables](/core/create/document-creation-api/tables.md) for presenting the same data numerically.
---
# Agent Instructions
This documentation is published with GitBook. GitBook is the documentation platform designed so that both humans and AI agents can read, navigate, and reason over technical content effectively. Learn more at gitbook.com.
## Querying This Documentation
If you need additional information that is not directly available in this page, you can query the documentation dynamically by asking a question.
Perform an HTTP GET request on the current page URL with the `ask` query parameter, and the optional `goal` query parameter:
```
GET https://docs.apryse.com/core/create/document-creation-api/charts.md?ask=&goal=
```
`ask` is the immediate question: it should be specific, self-contained, and written in natural language.
`goal` is optional and describes the broader end goal you are ultimately trying to accomplish on behalf of the user. GitBook uses it to tailor the answer towards what is most useful for that goal.
The response will contain a direct answer to the question and relevant excerpts and sources from the documentation.
Use this mechanism when the answer is not explicitly present in the current page, you need clarification or additional context, or you want to retrieve related documentation sections.