Charts are visual representations of data that turn numbers into graphs, such as bar charts, line charts, or pie charts. They help customers understand patterns, compare values, and communicate insights clearly, especially in use cases like financial reporting, tracking trends, and monitoring performance.
Spreadsheet Editor enables you to view and edit existing standard charts directly within their XLSX files. When working in edit mode, updates to the underlying data are reflected in real time, allowing you to quickly validate insights without leaving the document. All chart updates are preserved when the file is exported, ensuring no loss of formatting or configuration upon saving or sharing. With in‑app chart support, you can:
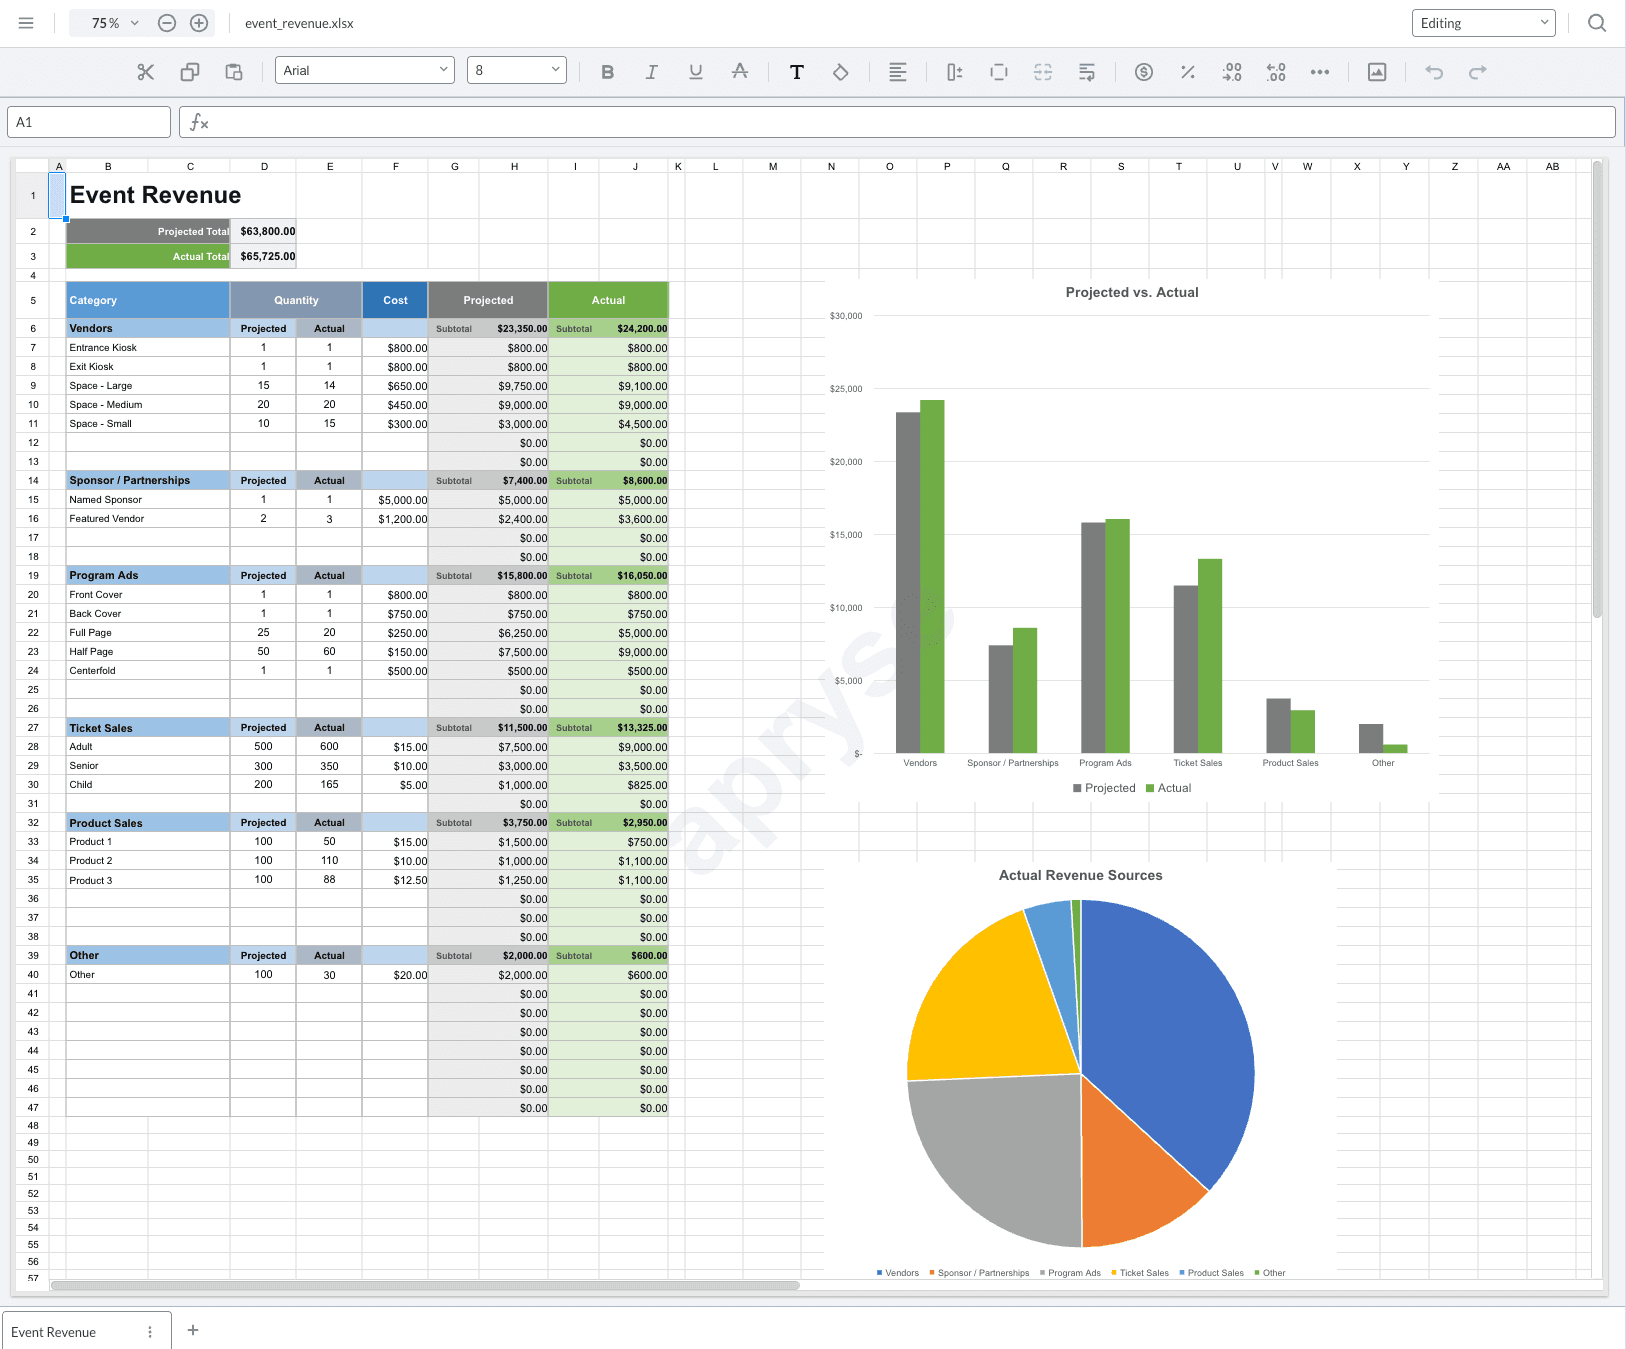
View spreadsheet data and charts together in the same workspace.
Modify chart data without switching applications.
Click a chart to select it, then move it to a different position in the spreadsheet and resize it by dragging its handles.
Programmatically edit and interact with charts.
Maintain chart fidelity when exporting, sharing, or reusing spreadsheets in other systems.
The editor also supports rendering of other floating objects, such as text boxes and shapes. These are graphical elements that sit above the spreadsheet grid, independent of individual cells.
Supported charts
The following charts are supported:
Column
Bar
Pie
Donut
Line
Area
Scatter
Stock
Radar
Histogram
Sunburst
3D chart types will render as 2D.
Unsupported charts
The following charts are unsupported at this time:
Treemap
Pareto
Box & Whisker
Waterfall
Map
Funnel
2D Map
Dynamic Charts with Dynamic Arrays
Interactive Drill-Down Charts
APIs
This section details the APIs available for all things related to charts. For examples of how to programmatically change cell values used in chart data, see the Edit Mode guide's Cells section.
Get the chart manager
The ChartManager class is a singleton that stores a reference to all charts within a workbook. Use this class when you want to interact with charts, such as selecting, moving, or resizing them.
Use the SpreadsheetEditorManager.getChartManager API to get the chart manager. If the workbook contains no charts, the chart manager is undefined, and the API returns null.
10 console.log('Charts were found in the workbook', chartManager);
11 }
12 });
13 });
Get charts from a specific sheet
Use ChartManager.getChartsFromSheet API to get a list of charts from the specified sheet index. The following code sample iterates through all sheets in a workbook and logs the charts from each sheet.
If you ever need to deselect, you can use the ChartManager.deselectChart API to programmatically deselect a chart. The following code sample shows how to deselect a chart.
Use the ChartManager.getSelectedChart API to get a reference to the currently selected chart. The following code sample selects the first chart in a sheet and gets its reference.
Use the ChartManager.moveChart API to move the chart's position on a sheet. Charts cannot be moved outside of the viewport. The following code sample shows how to move the first chart on the sheet to the top-left corner (0, 0).
Use the ChartManager.resizeChart API to adjust the chart's size. Charts cannot be resized beyond the viewport and must have a minimum size of 50x50 pixels. The following code sample gets the first chart on a sheet and resizes it to a 300x300 square.